Features
c9watch gives you and your agents a real-time view of every Claude Code session running on your machine. The desktop app is for you — the CLI is for your agents. Both share the same detection engine, so you’re always looking at the same data. Here’s everything it can do.
Zero-integration setup
Section titled “Zero-integration setup”Works with any terminal or IDE — no plugins or extensions required. Start Claude Code from VS Code, Zed, iTerm2, Ghostty, tmux, Terminal.app, Antigravity, or any of the 15+ supported JetBrains IDEs, and c9watch picks them all up automatically.
Unlike other Claude Code management tools that require you to launch sessions from within their app, c9watch discovers them by scanning running processes at the OS level. No workflows to change. No vendor lock-in.
Auto-discovery
Section titled “Auto-discovery”A background thread polls every 2 seconds using the sysinfo crate, scanning for running claude processes. Each process is matched to its session file in ~/.claude/projects/ via path encoding and timestamp correlation.
New sessions appear automatically in the dashboard within seconds of starting. Ended sessions are removed. No manual refresh needed.
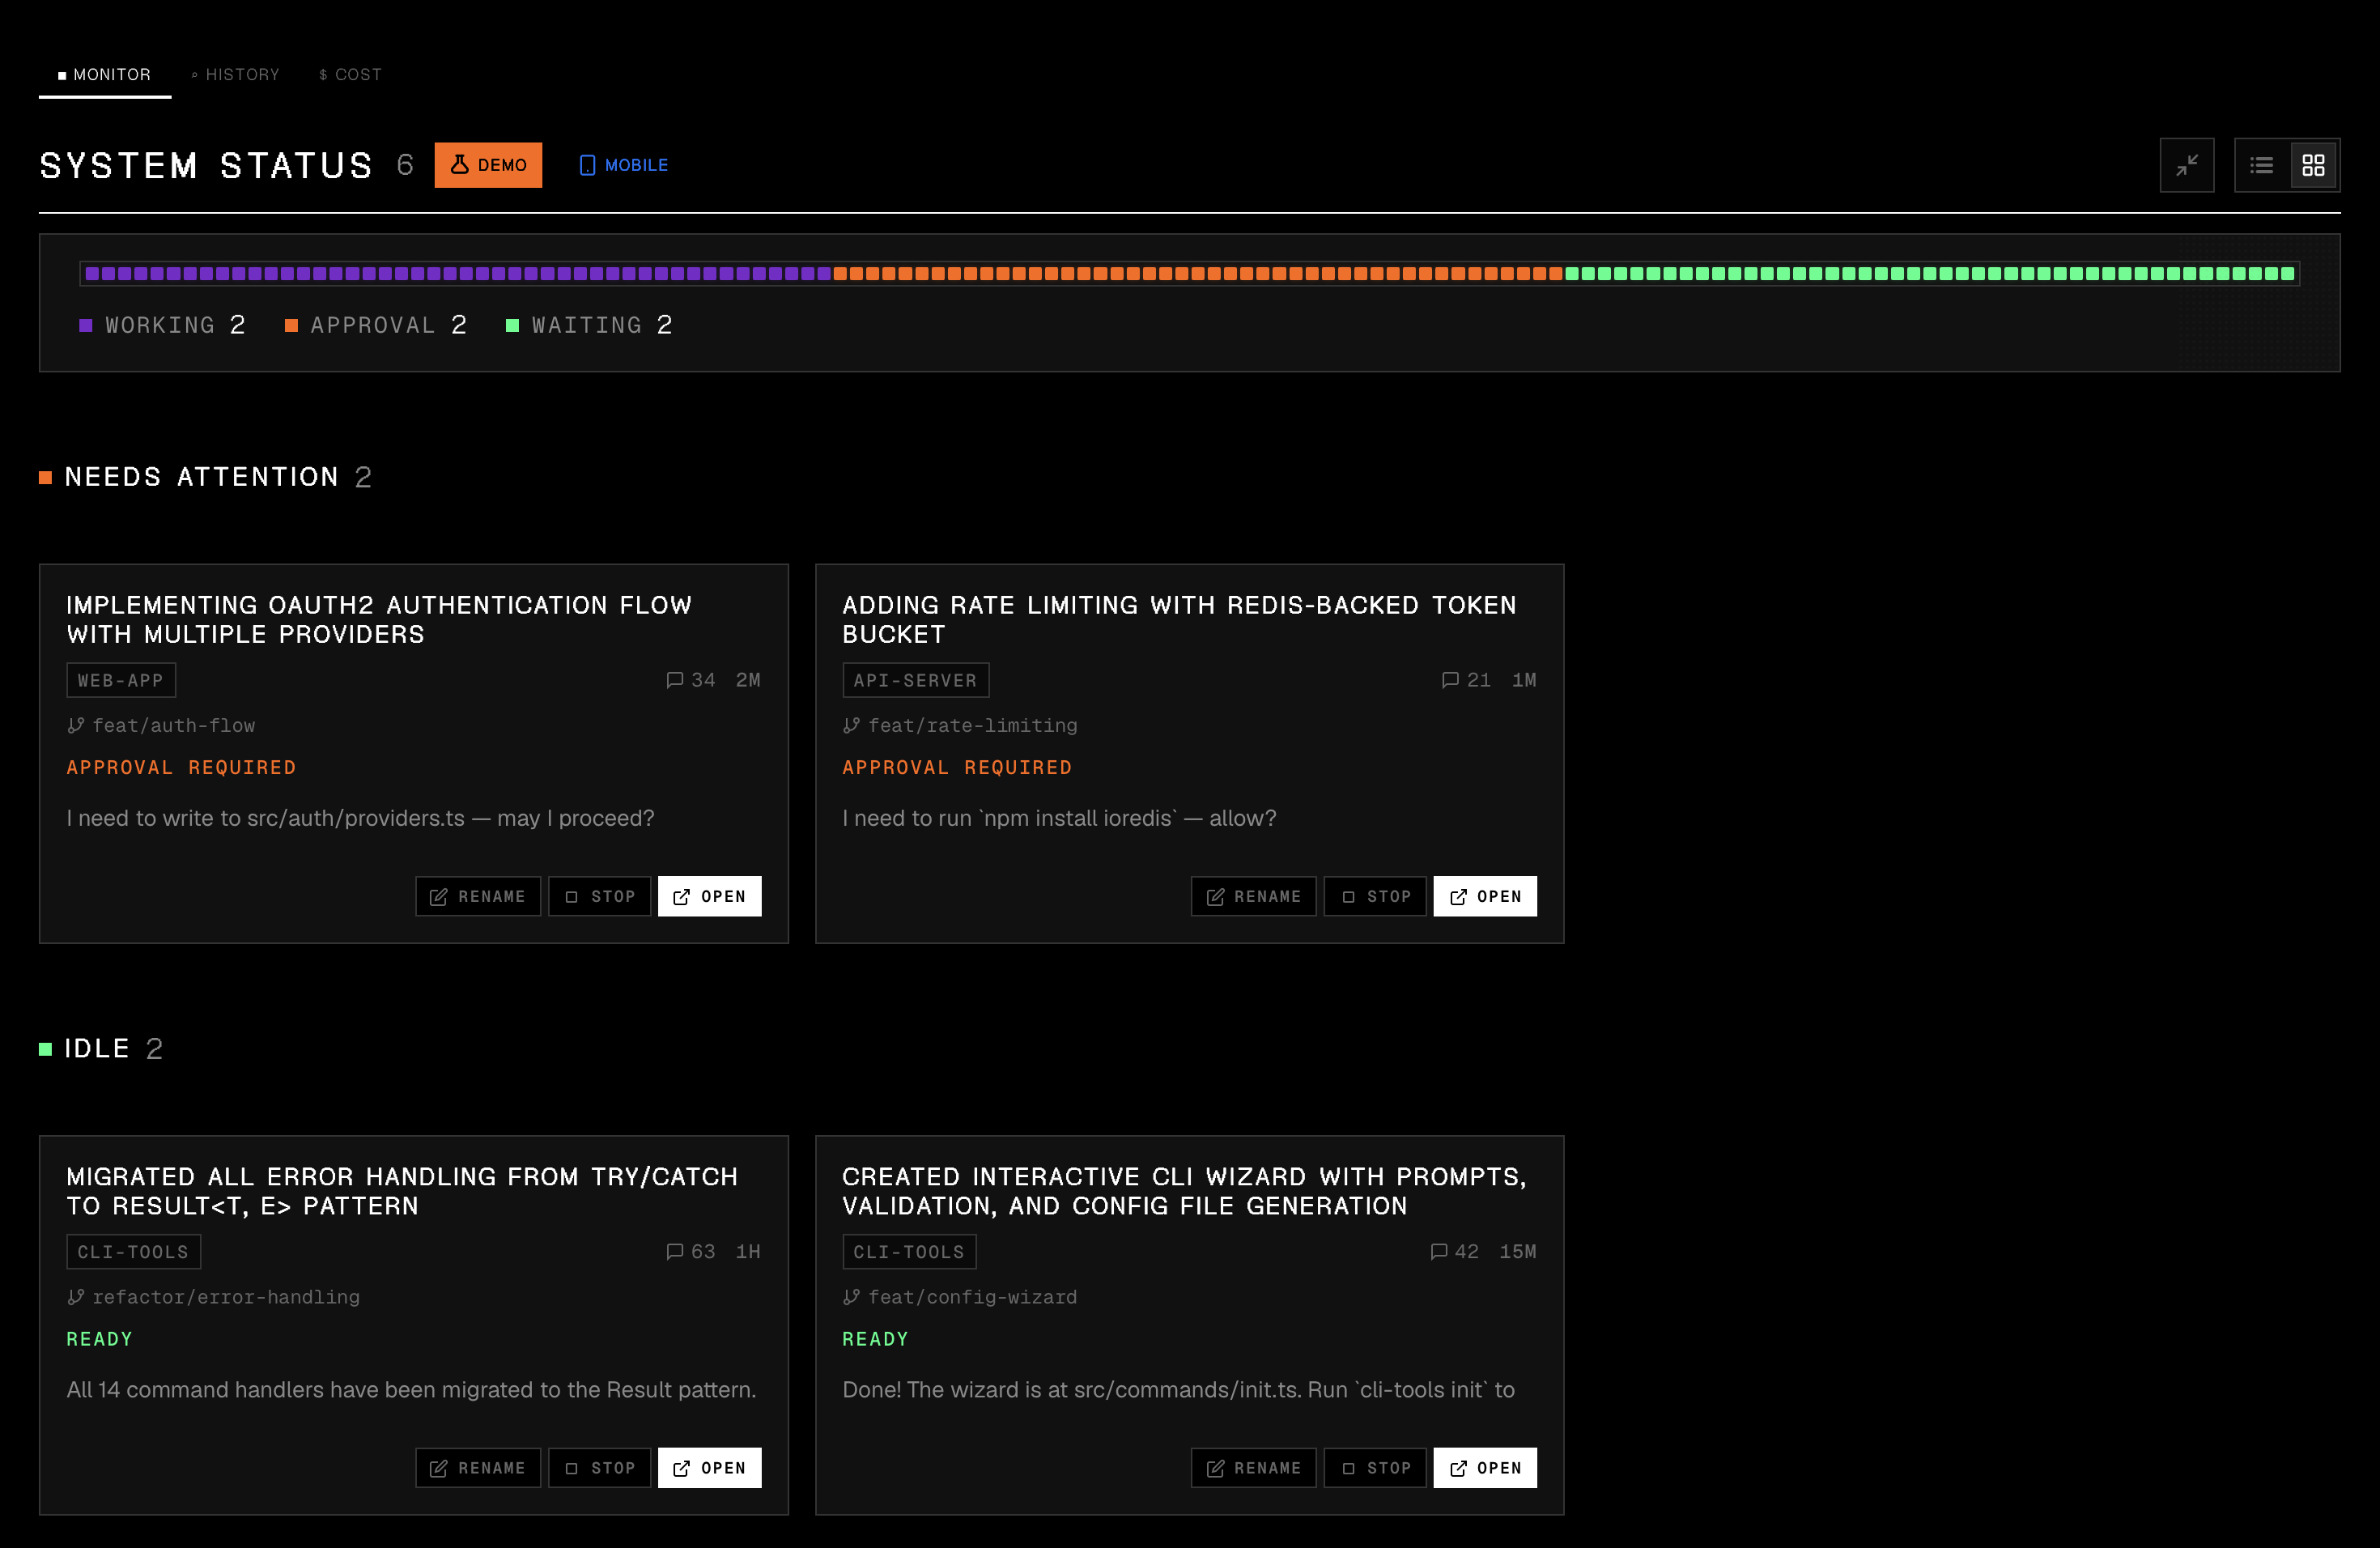
Real-time status
Section titled “Real-time status”Every session shows its current status at a glance:
- Working — Claude is generating a response or executing tools
- Needs Permission — A tool is pending that requires your approval
- Idle — Session is waiting for your next prompt
Sessions are sorted by priority — permission requests surface to the top so you never leave an agent stuck waiting. Each card also shows the model name, project path, git branch, current tool being executed, and elapsed time.
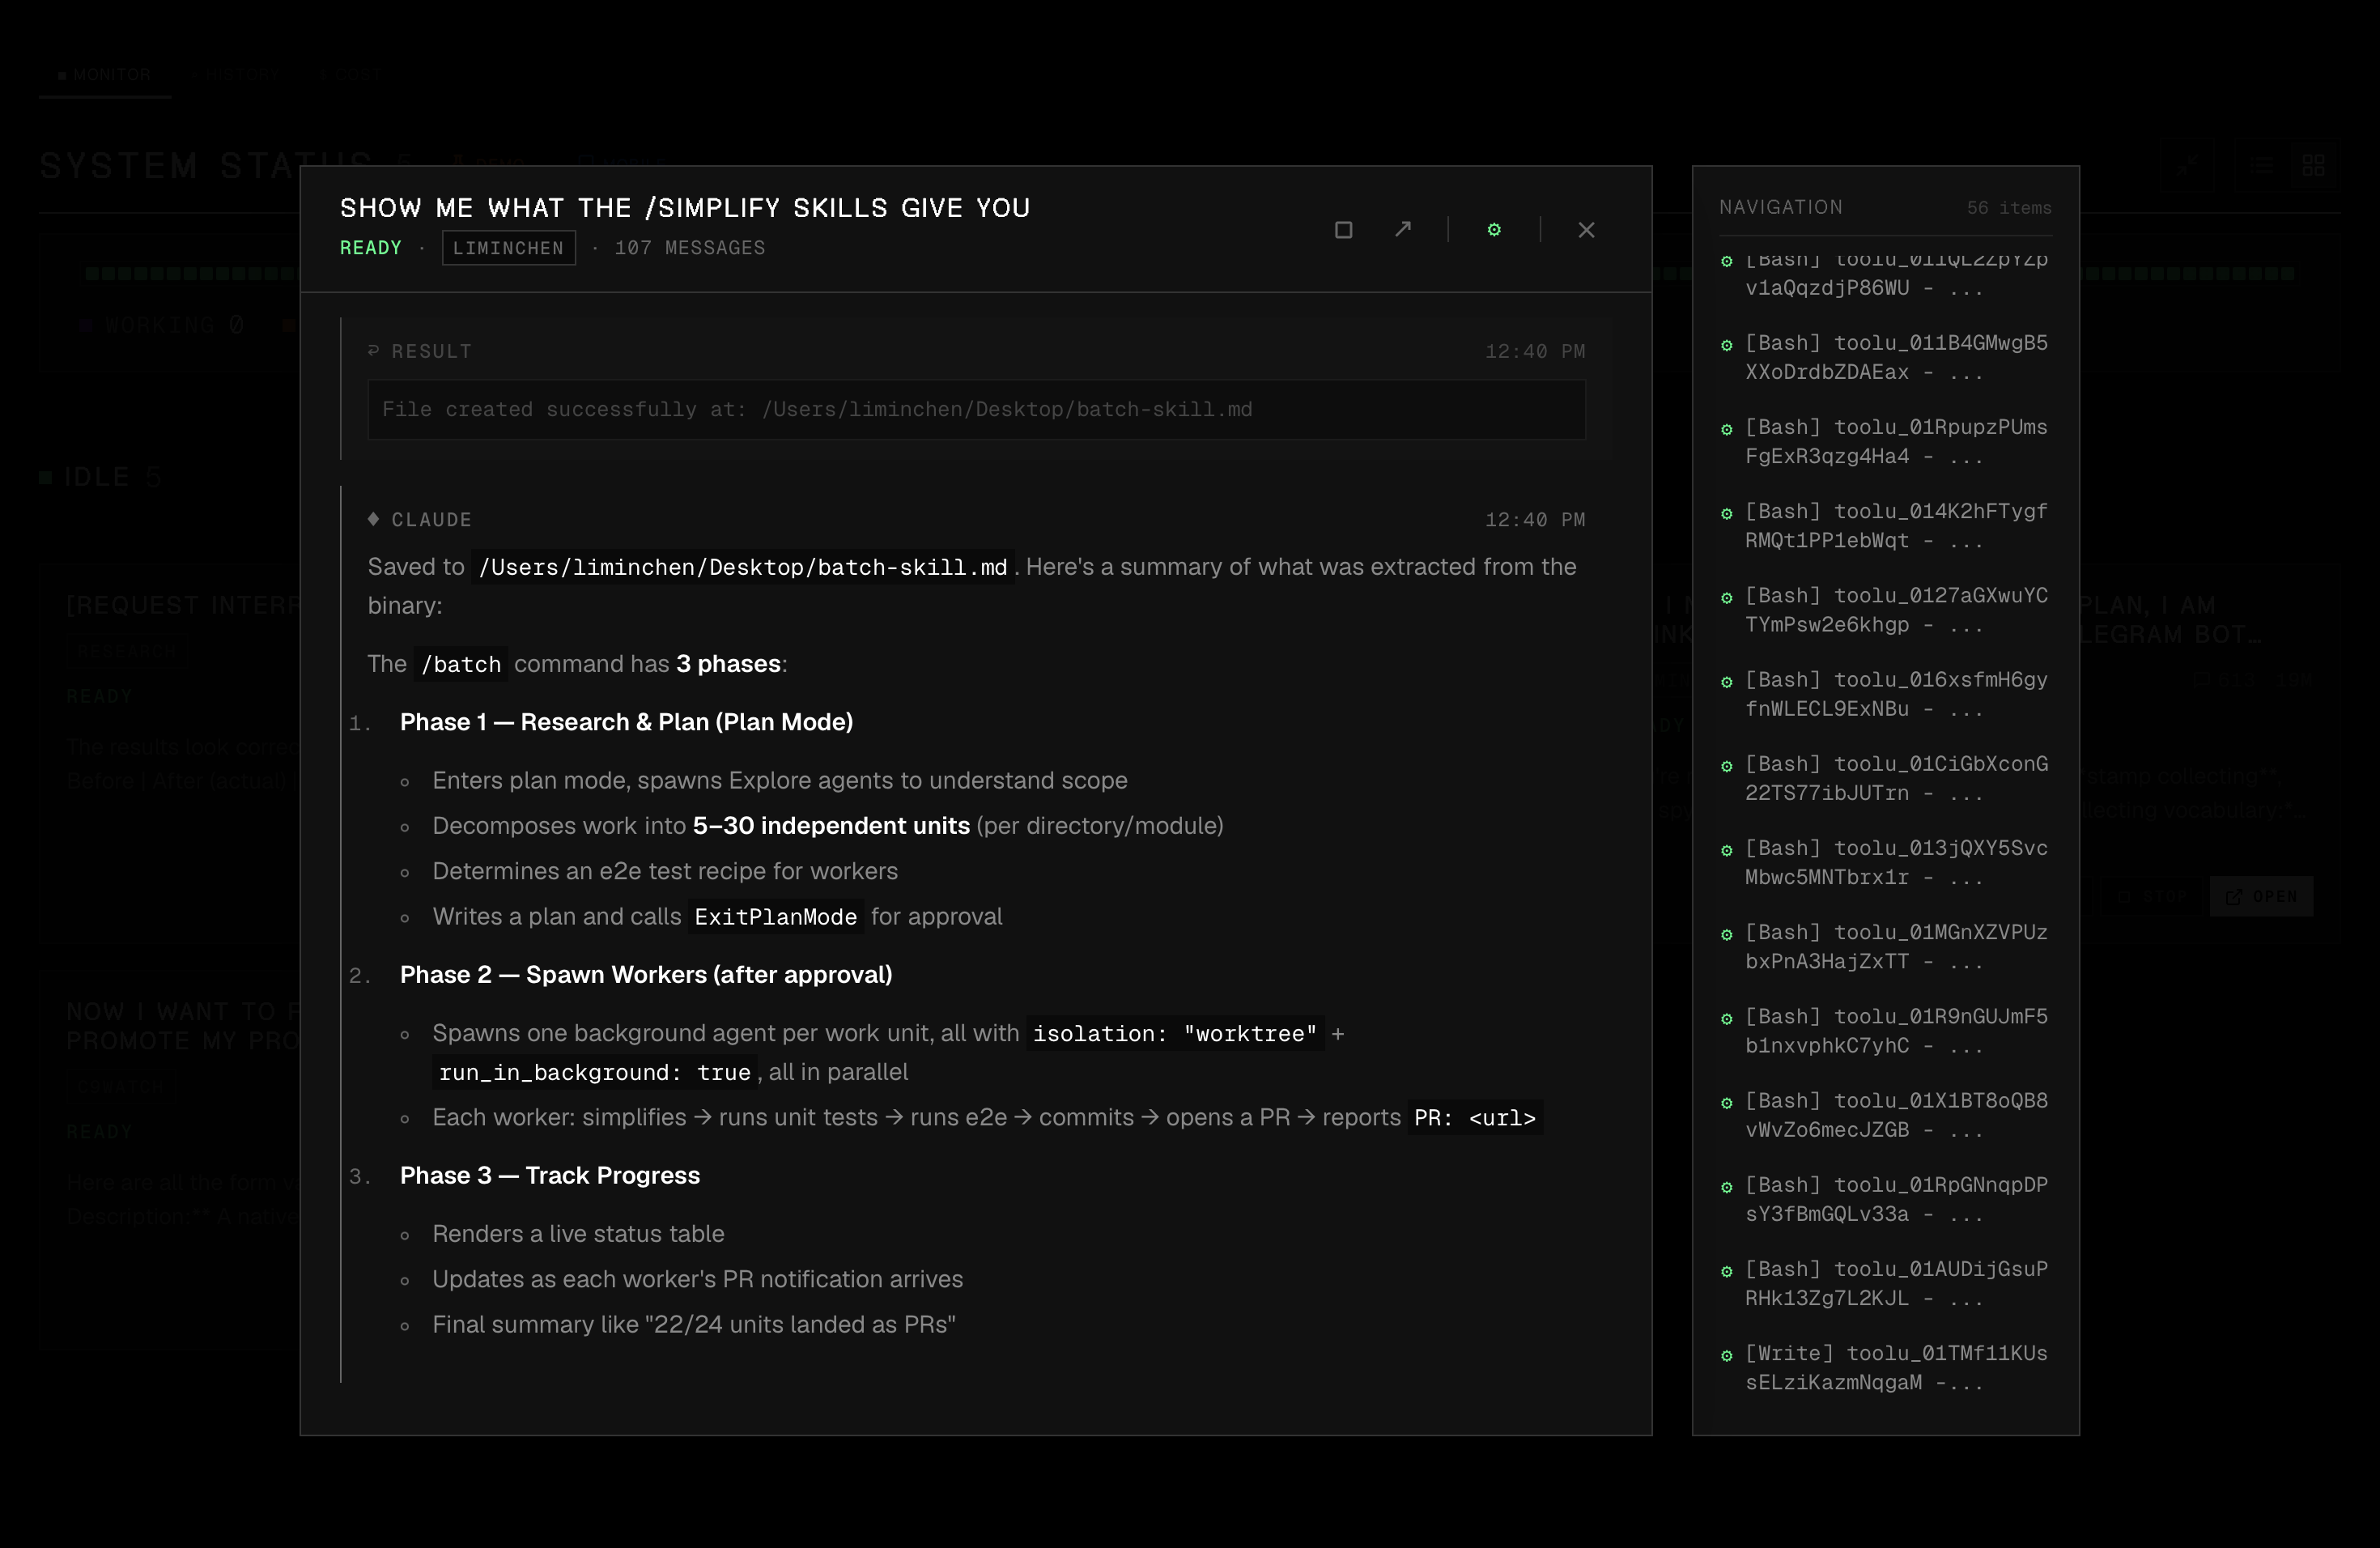
Conversation viewer
Section titled “Conversation viewer”Expand any session — live or from history — to see the full conversation. Messages are rendered with full markdown formatting, syntax-highlighted code blocks, inline images (for screenshots pasted in user messages), and tool call details.
A navigation sidebar on the right shows all messages for quick jumping. Tool call messages can be toggled on or off to focus on the conversation flow.
Session control
Section titled “Session control”From the dashboard, you can:
- Stop a running session
- Open the parent terminal or IDE where the session is running
- Rename sessions with custom titles for easier tracking
- Resume a past session — click the RESUME chip to copy the command
Multi-project view
Section titled “Multi-project view”Sessions are grouped by project directory, with git branch information shown for each group. When you’re running agents across multiple projects, this lets you see at a glance which project each session belongs to.
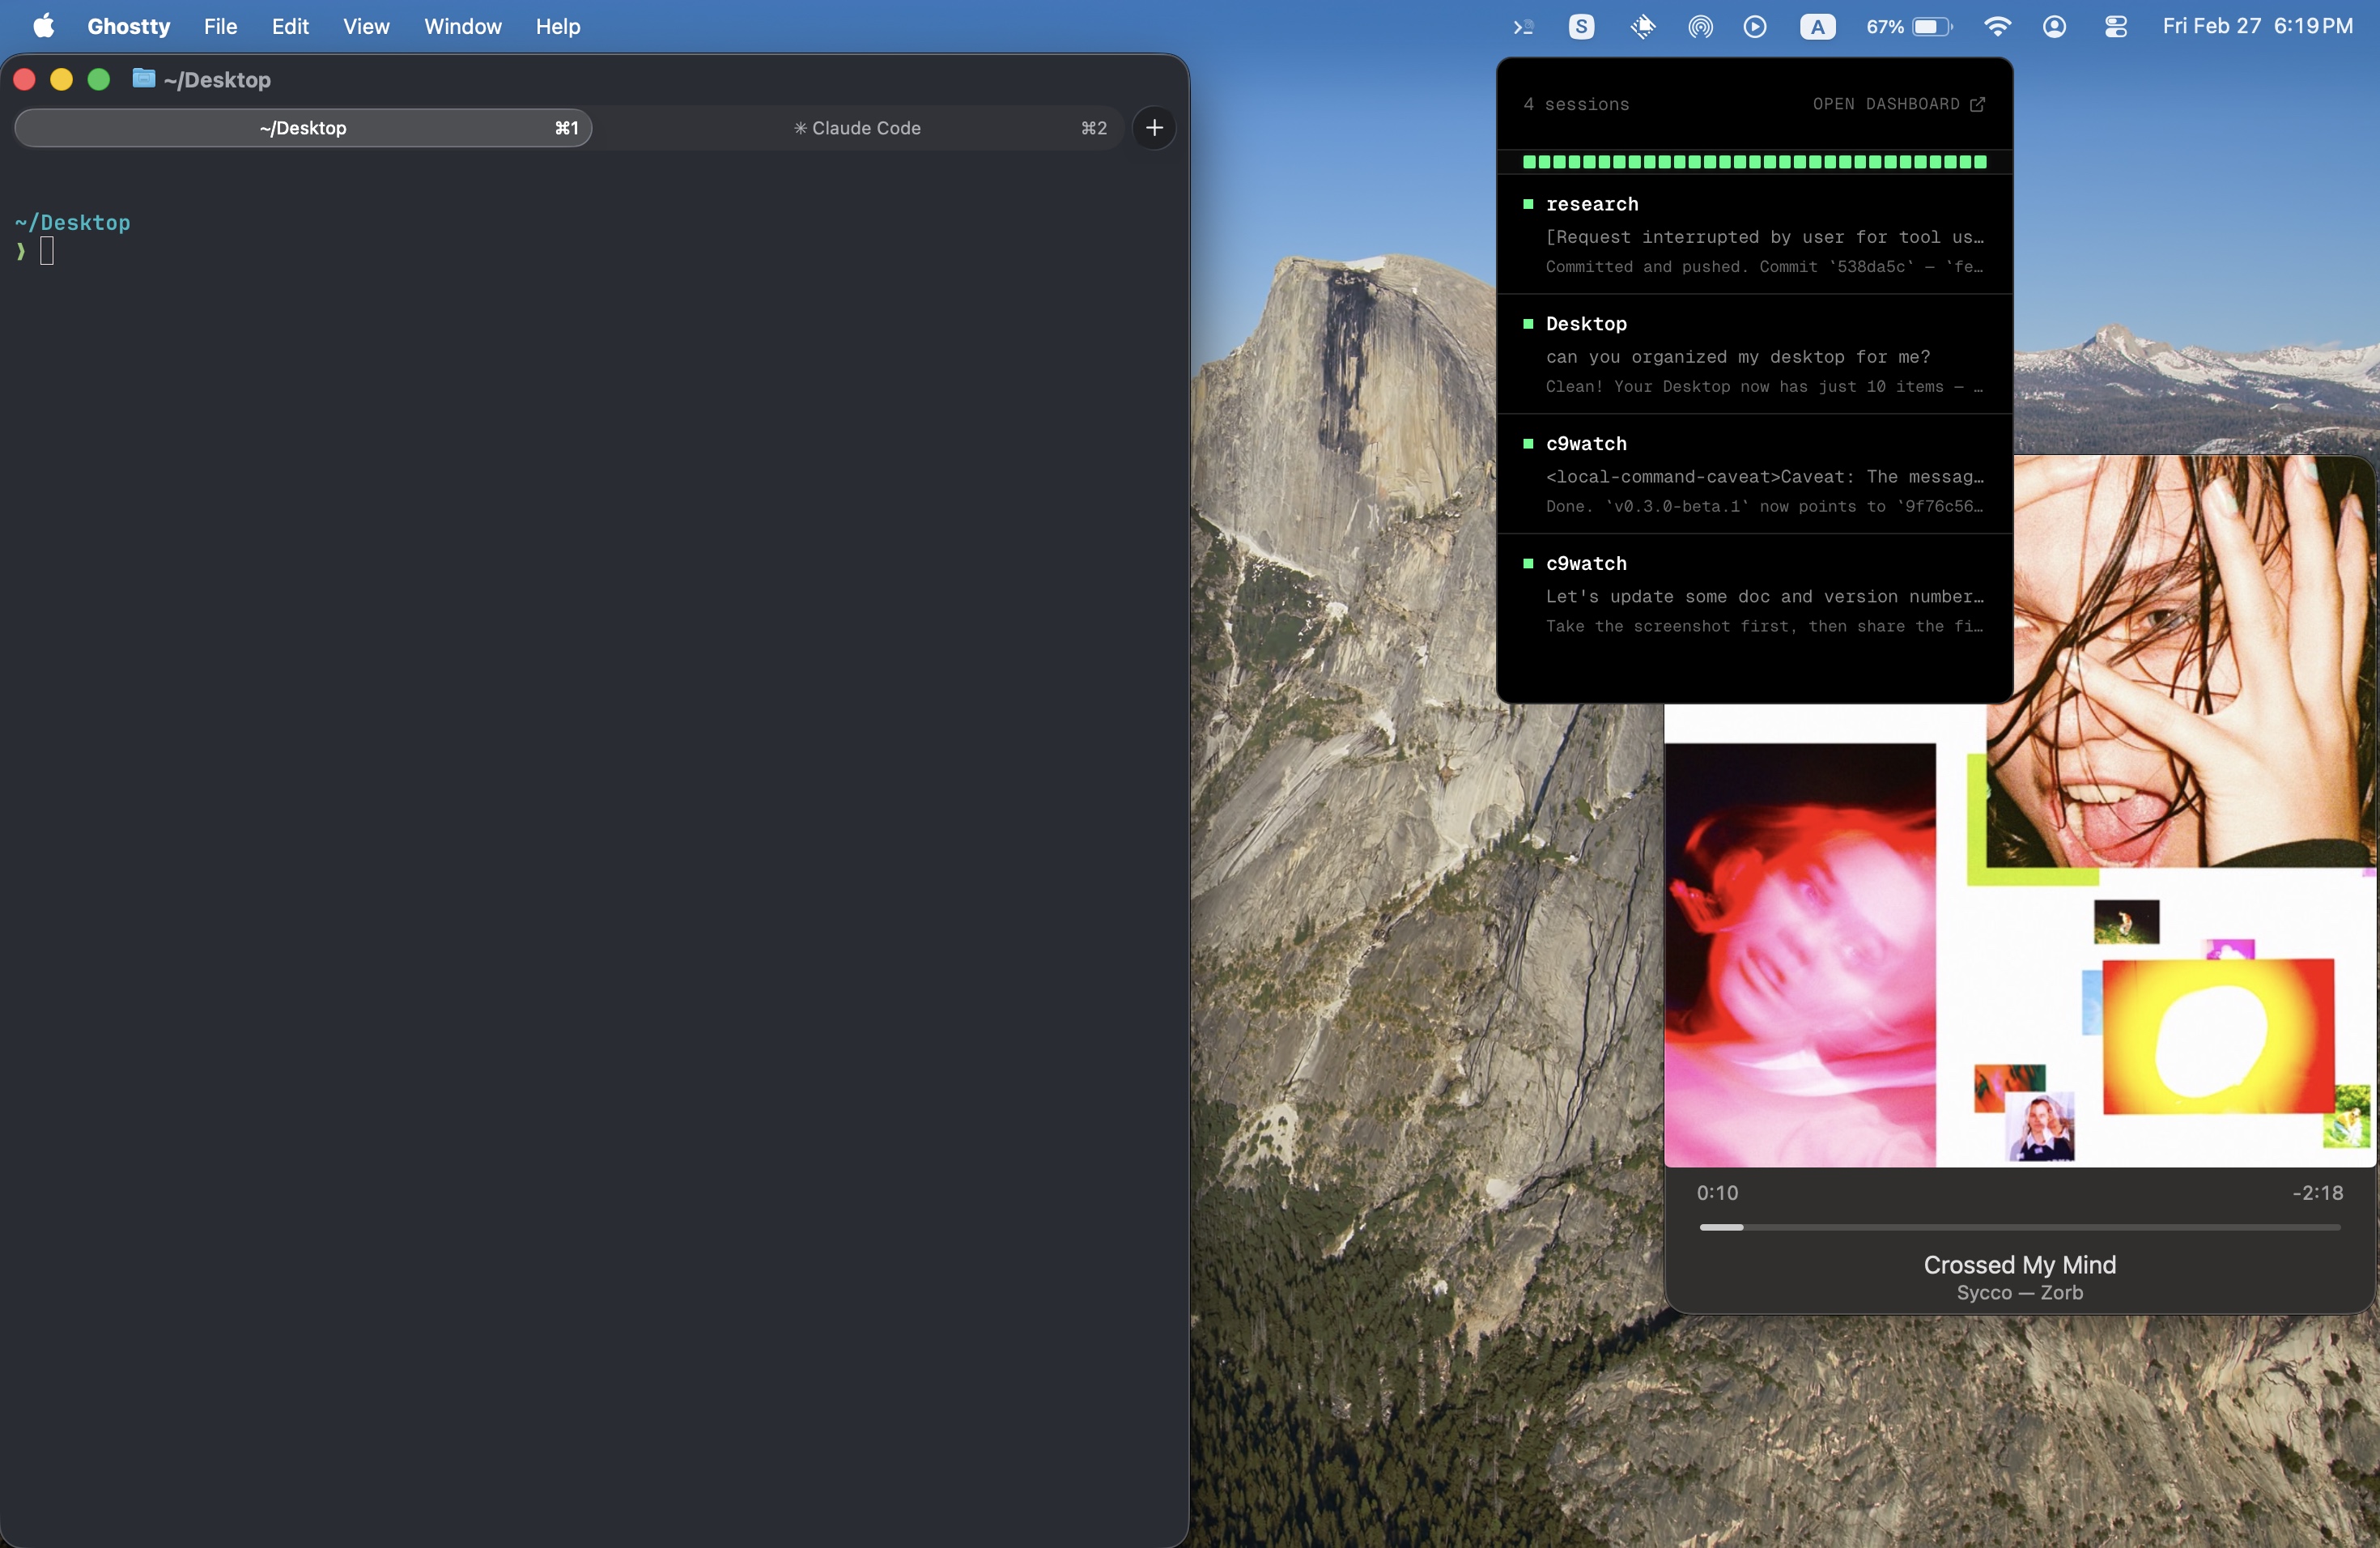
Tray popover
Section titled “Tray popover”Click the c9watch icon in the macOS menu bar to see a quick-glance overlay showing all active sessions, their status indicators, and latest messages. Monitor without opening the full dashboard.
The popover uses a native macOS NSPanel, so it appears above full-screen apps and behaves like a system-level overlay.
Status notifications
Section titled “Status notifications”Get a native macOS notification when a session changes status — especially useful when a session needs your permission approval. Never miss a waiting agent again, even when you’re working in another app.
Mobile / Web client
Section titled “Mobile / Web client”c9watch includes a built-in WebSocket server that lets you connect from any browser or mobile device on the same network. Scan the QR code displayed in the app to open a real-time web dashboard on your phone — perfect for monitoring sessions from the couch.
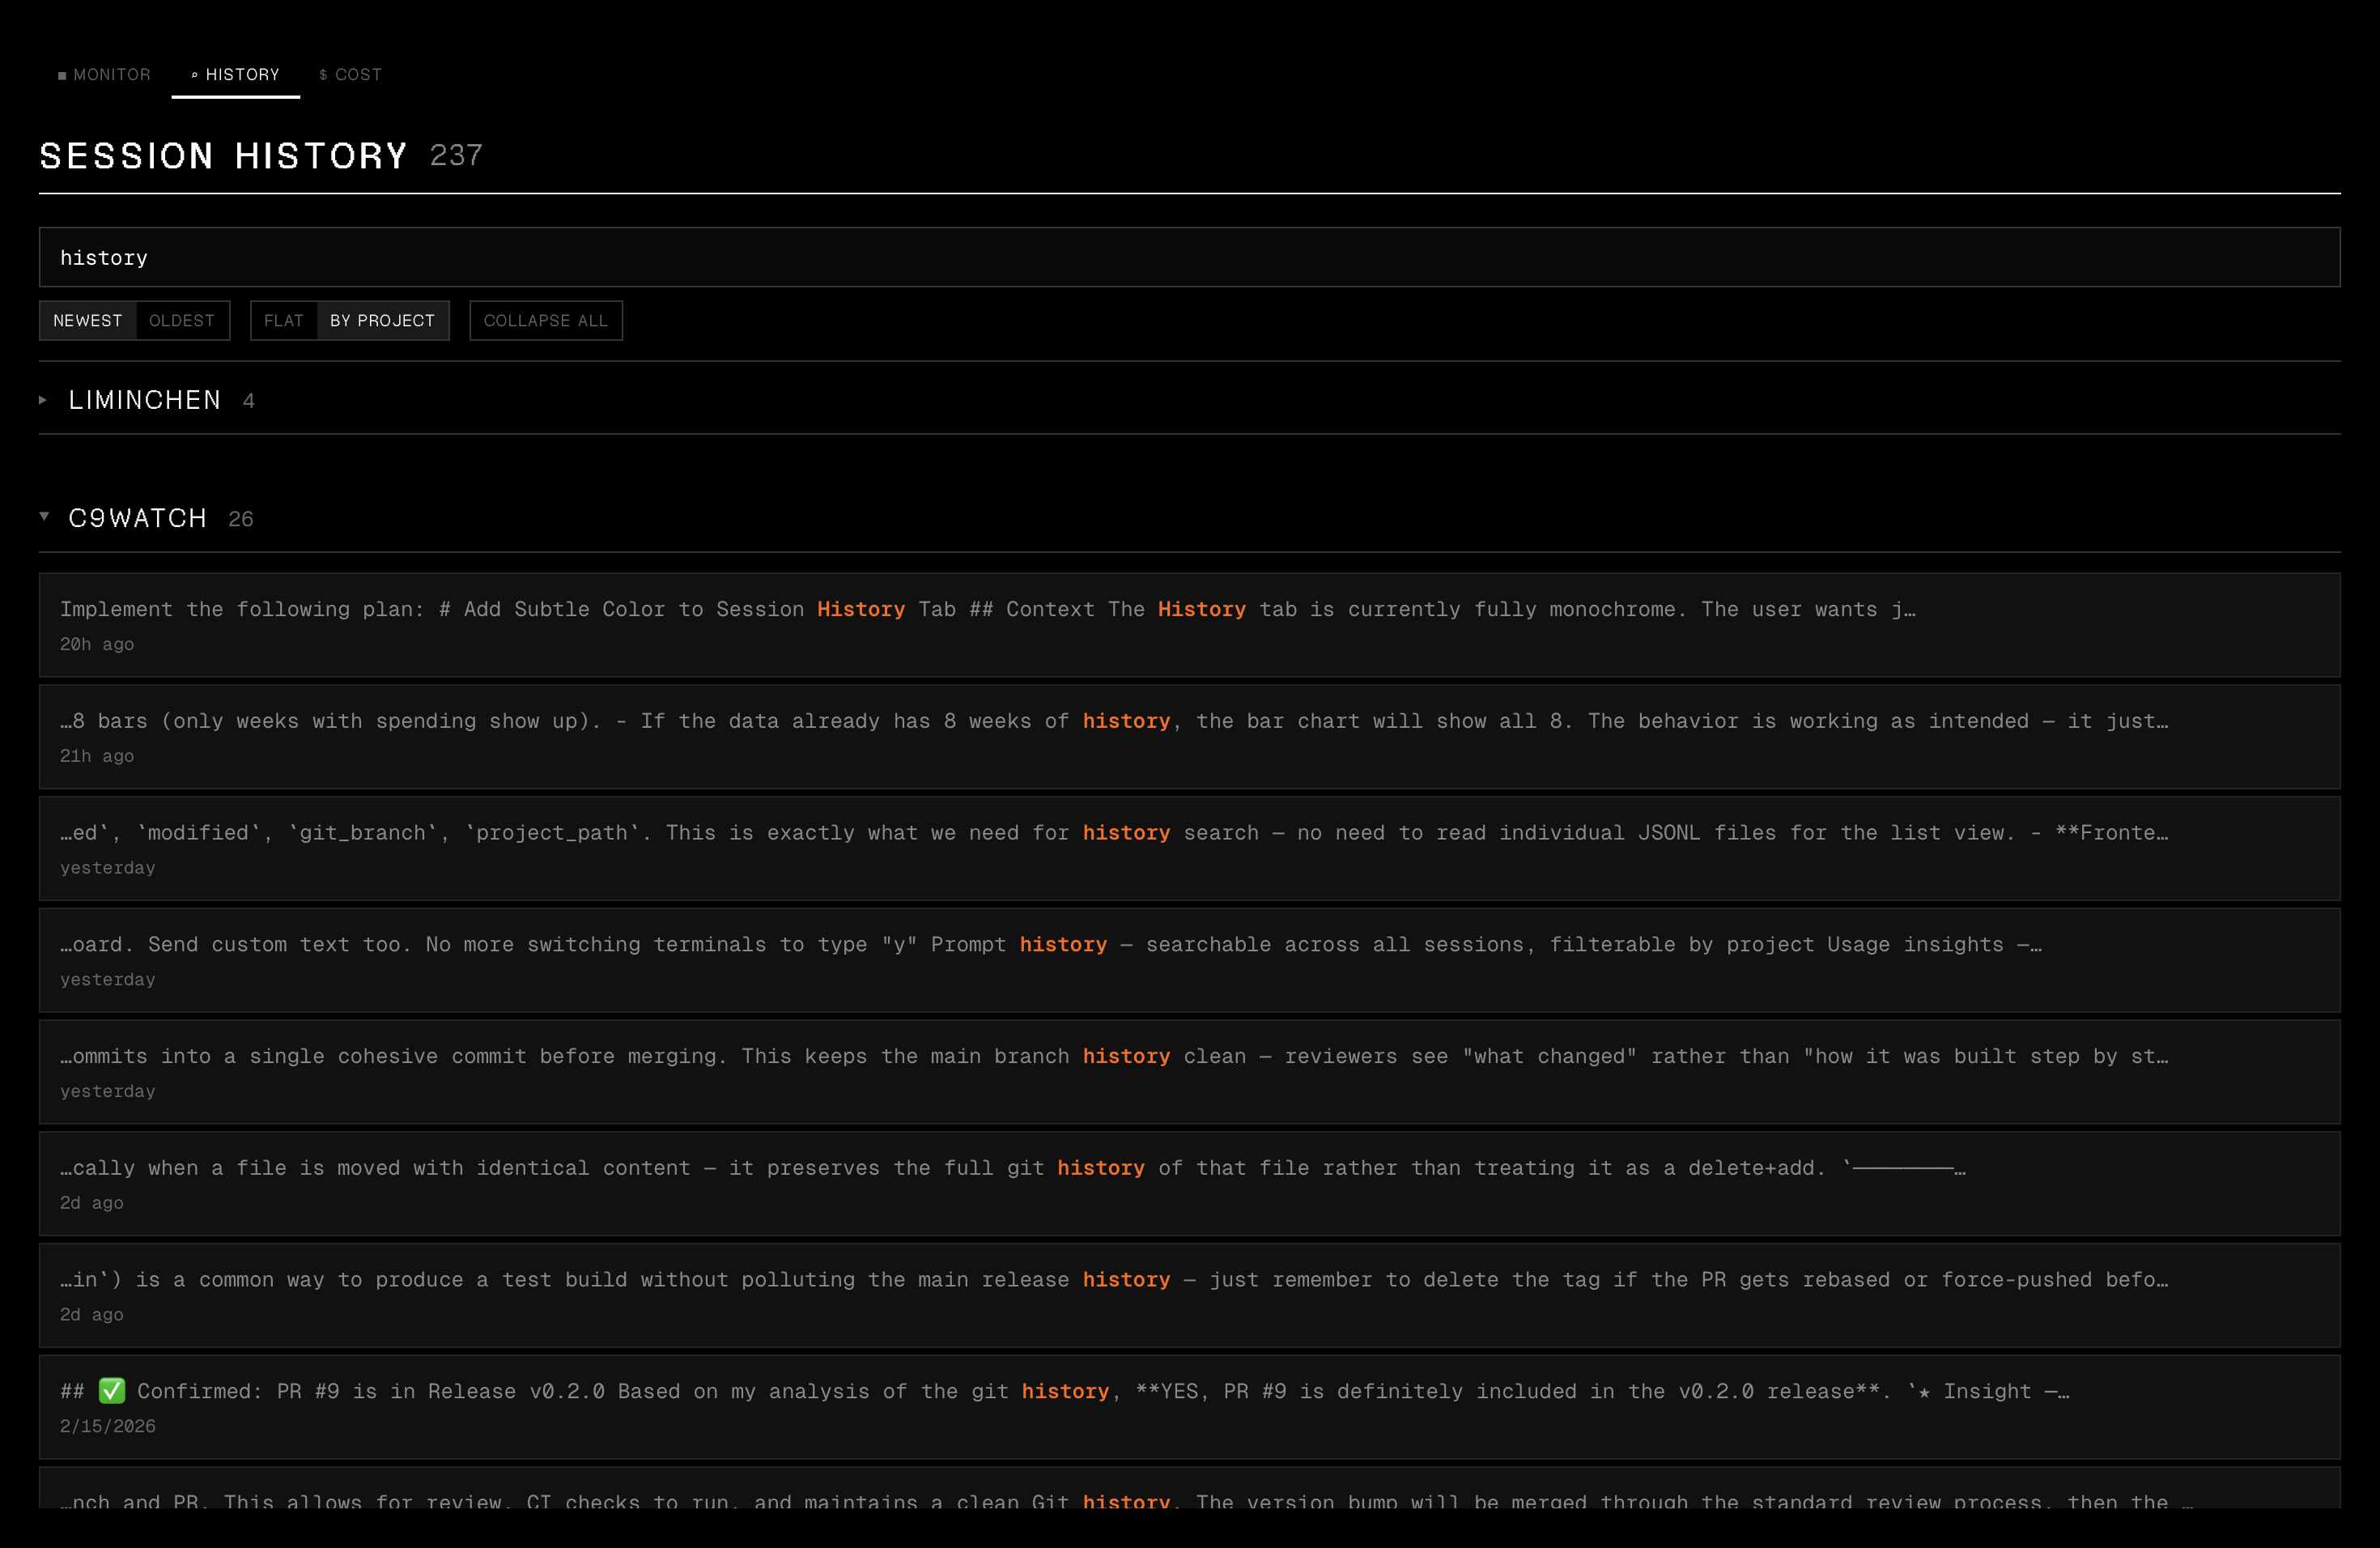
Session history
Section titled “Session history”Browse all past Claude Code sessions with two search modes:
- Metadata filter — instant search by project name, session title, or date
- Deep content search — searches inside the actual conversation content across all session JSONL files
Click a deep search result to open the conversation viewer and automatically scroll to and highlight the matching message. Sessions can be viewed chronologically or grouped by project with collapsible groups.
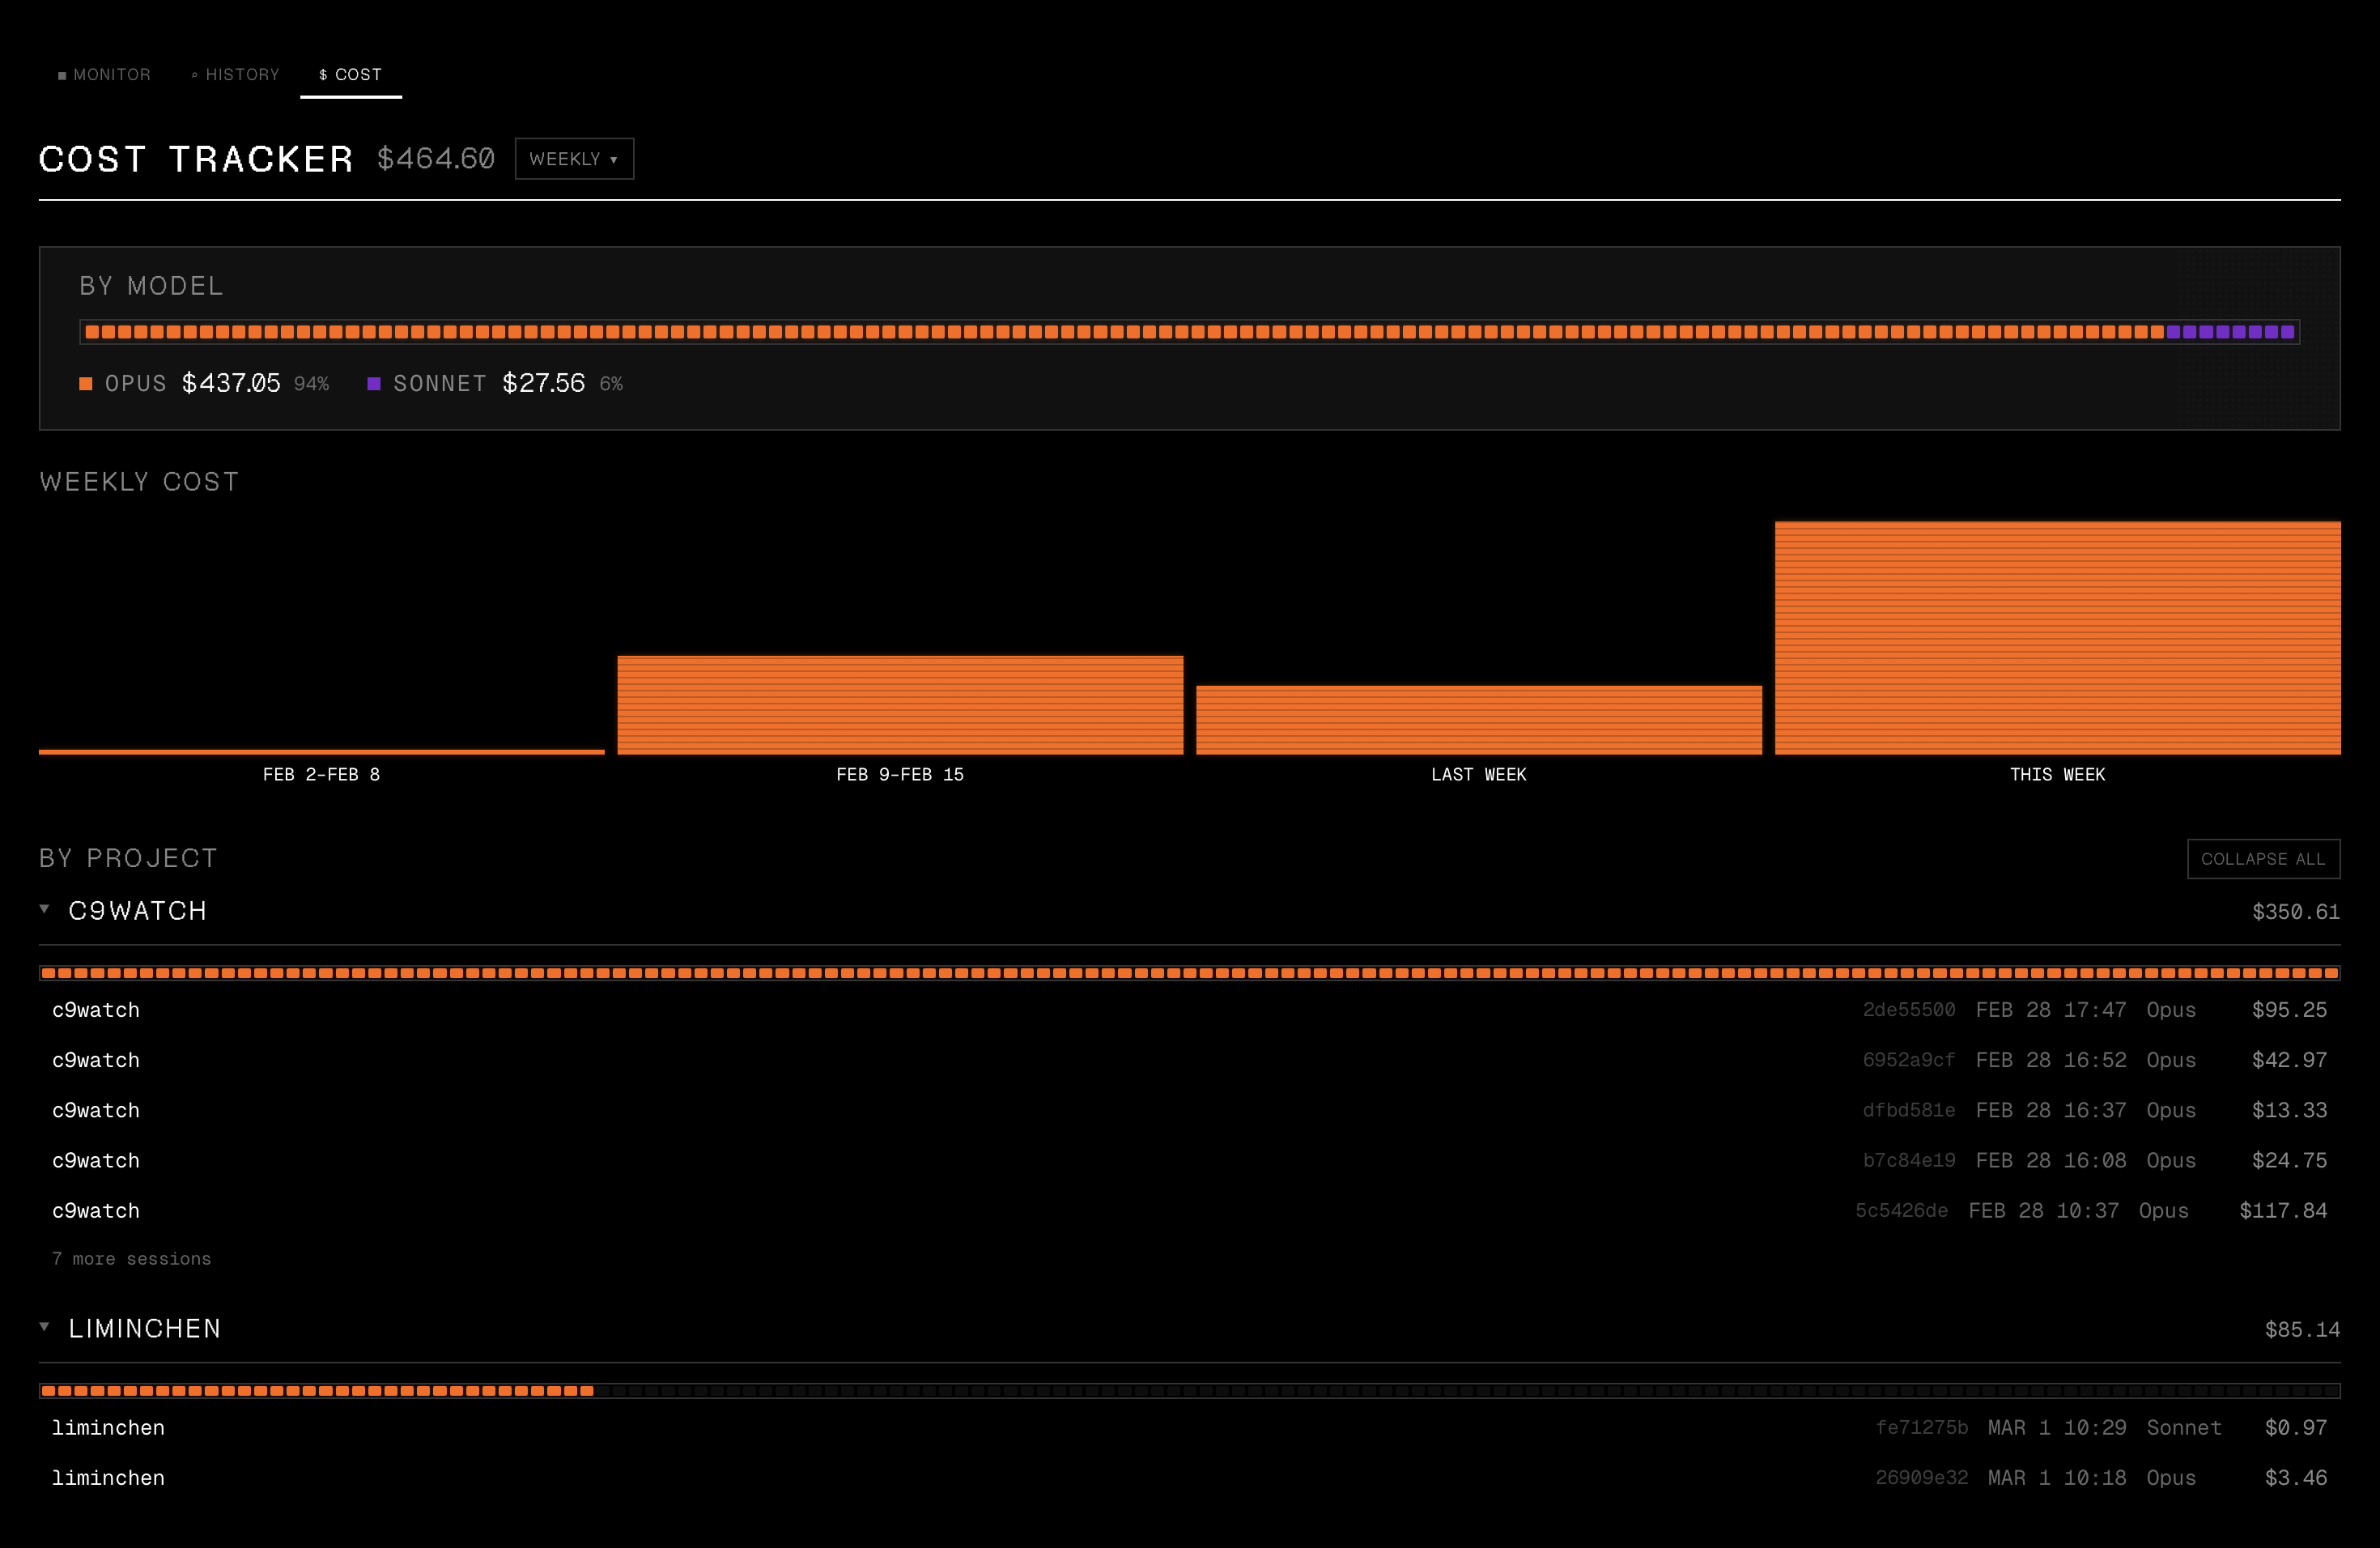
Cost tracker
Section titled “Cost tracker”Track your Claude Code spending across all sessions with three views:
- Daily — spending over time, bar chart with per-day breakdown. Sessions spanning midnight are correctly split by date.
- By project — total cost per project directory with session count, expandable session list showing session names (custom title or first user message), and DATE/COST sort toggles
- By model — spending split by Claude model (Sonnet, Opus, Haiku)
Click any session row to open a conversation preview overlay — the same viewer used in the history tab.
Costs are computed by parsing assistant message metadata from JSONL files, using per-model pricing tables. Results are cached by file modification time so unchanged sessions aren’t re-scanned.
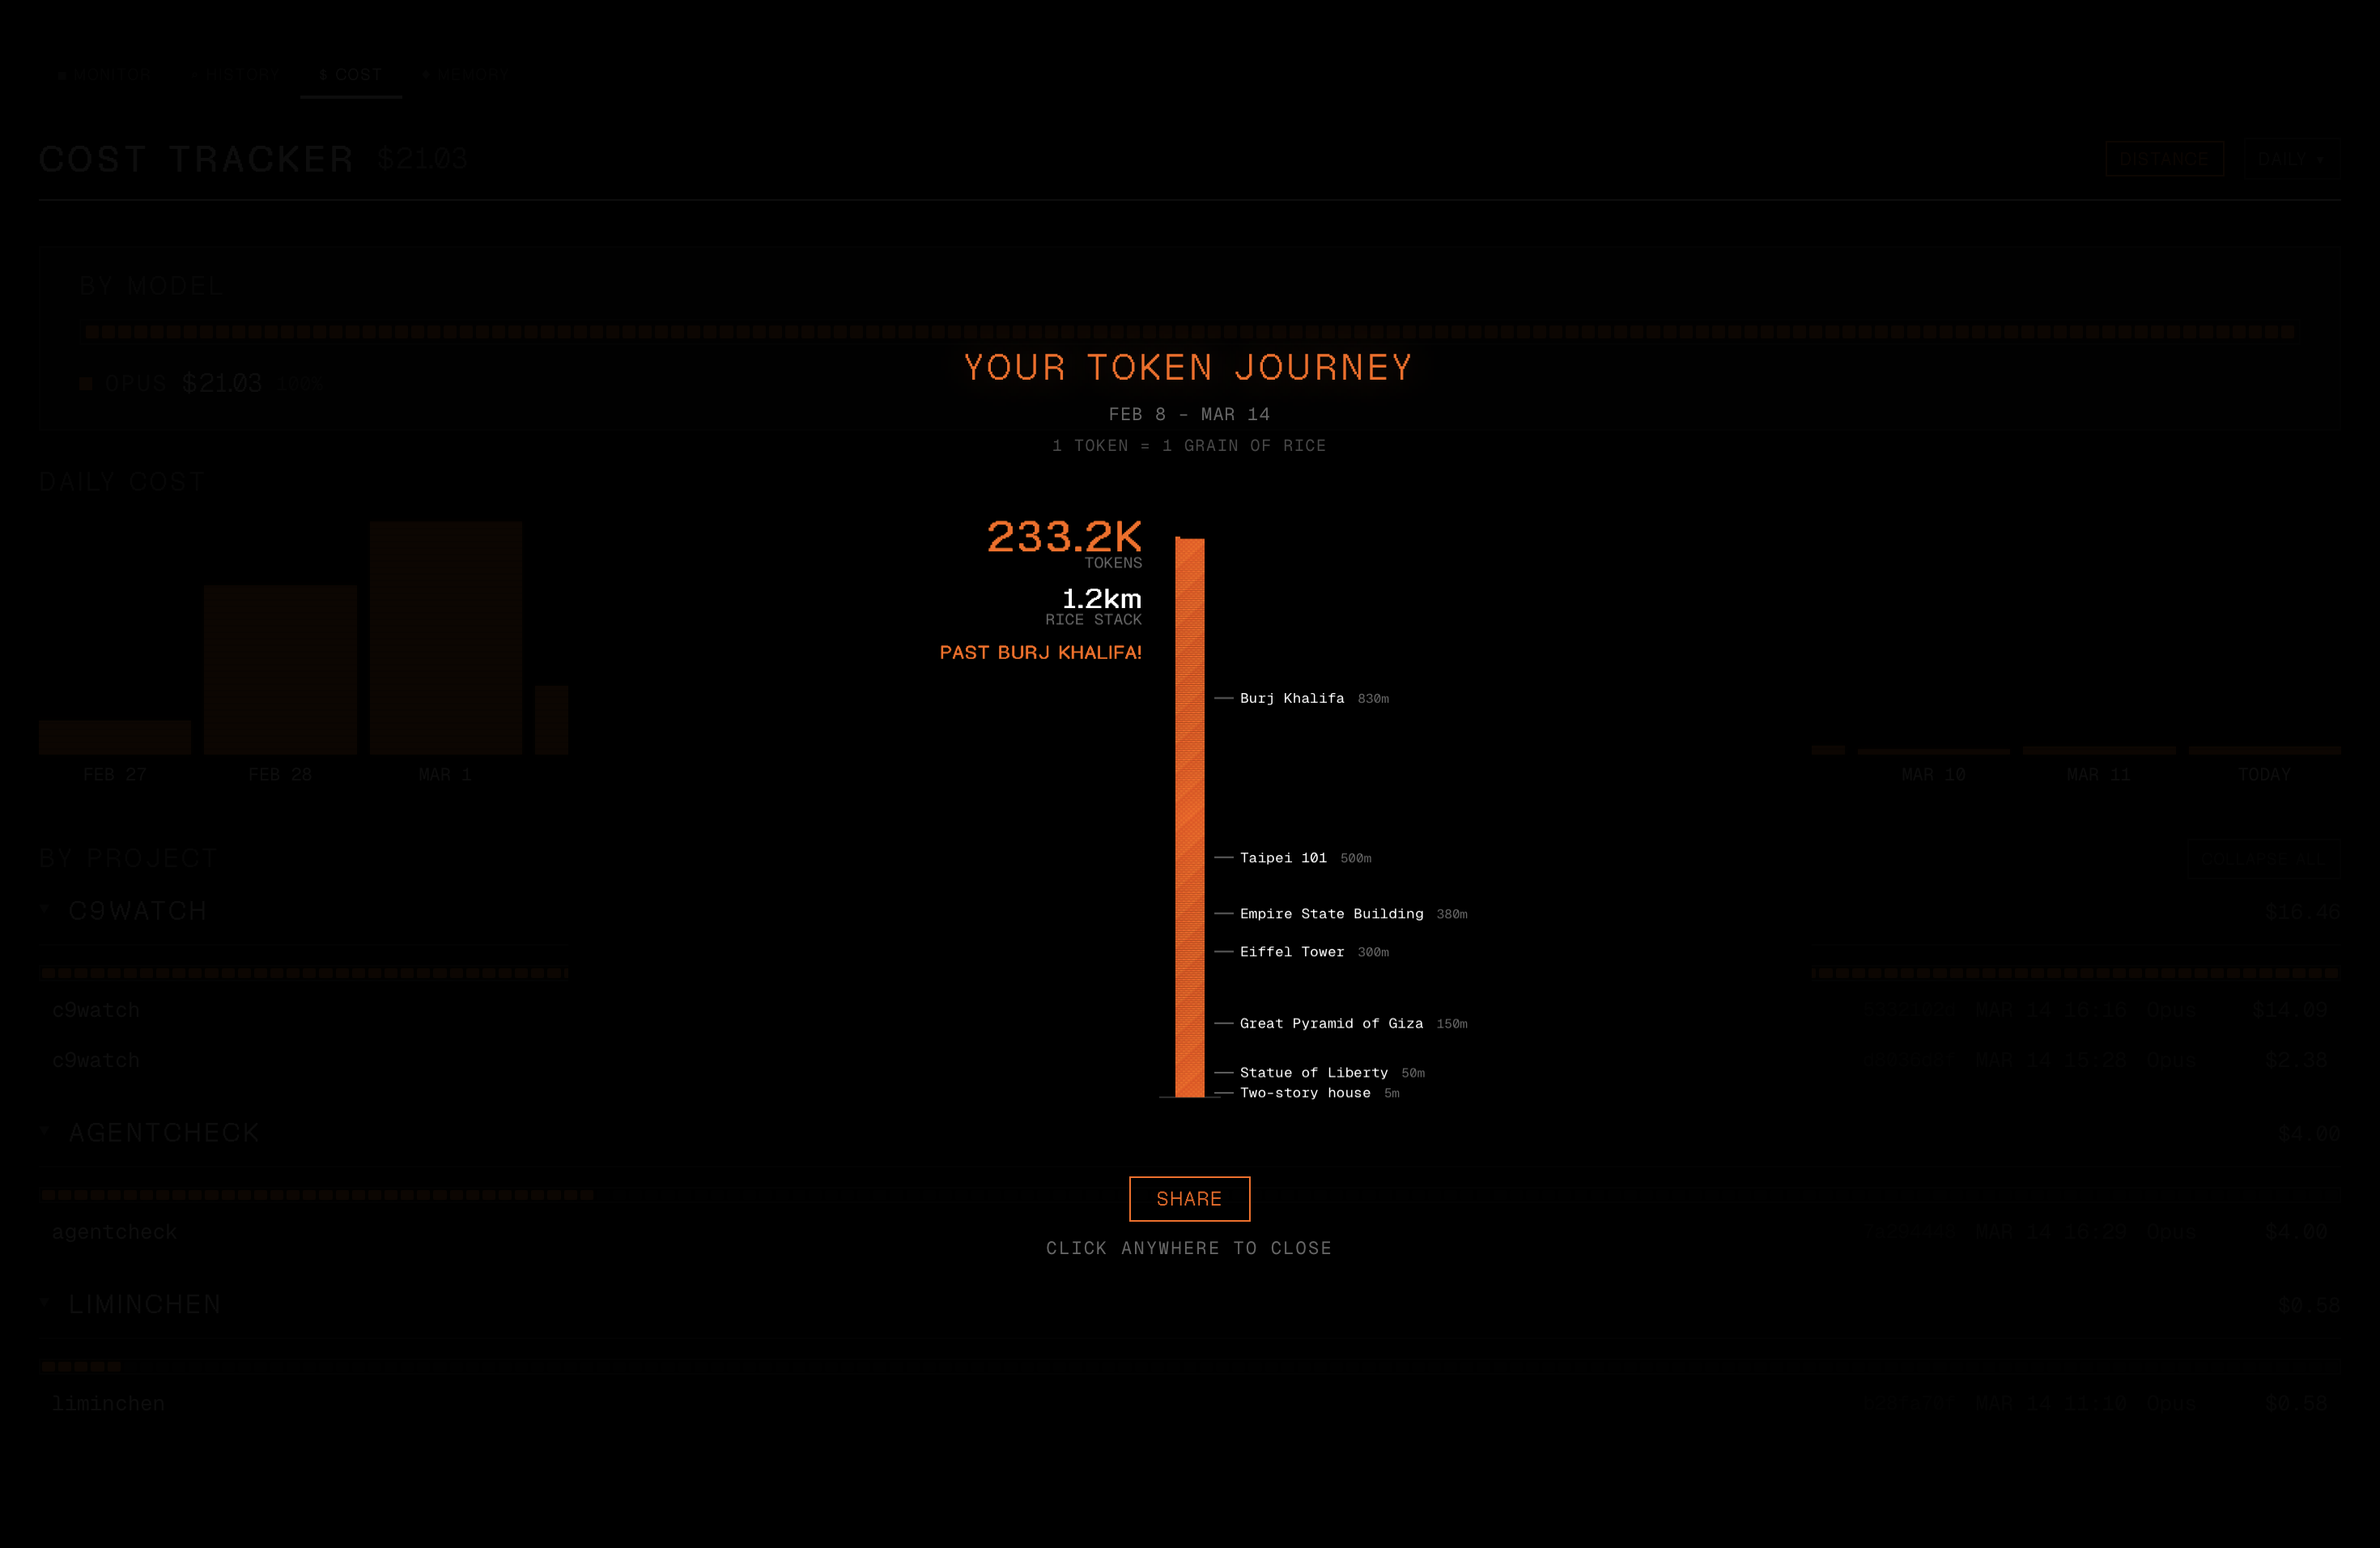
Token distance visualizer
Section titled “Token distance visualizer”Ever wonder how much your token usage would look like in the physical world? The token distance visualizer converts your total tokens into a rice stack — one token equals one grain of rice (5mm tall) — and animates grains stacking up past 17 real-world landmarks.
Milestones range from a two-story house to the Moon, with everything from the Eiffel Tower, Taipei 101, and Mount Everest in between. The animation uses a 3-phase easing with continuous camera zoom-out as the stack grows.
Click SHARE to open the native macOS share sheet, or export an Instagram-ready PNG (1080×1350) with your stats and c9watch watermark.
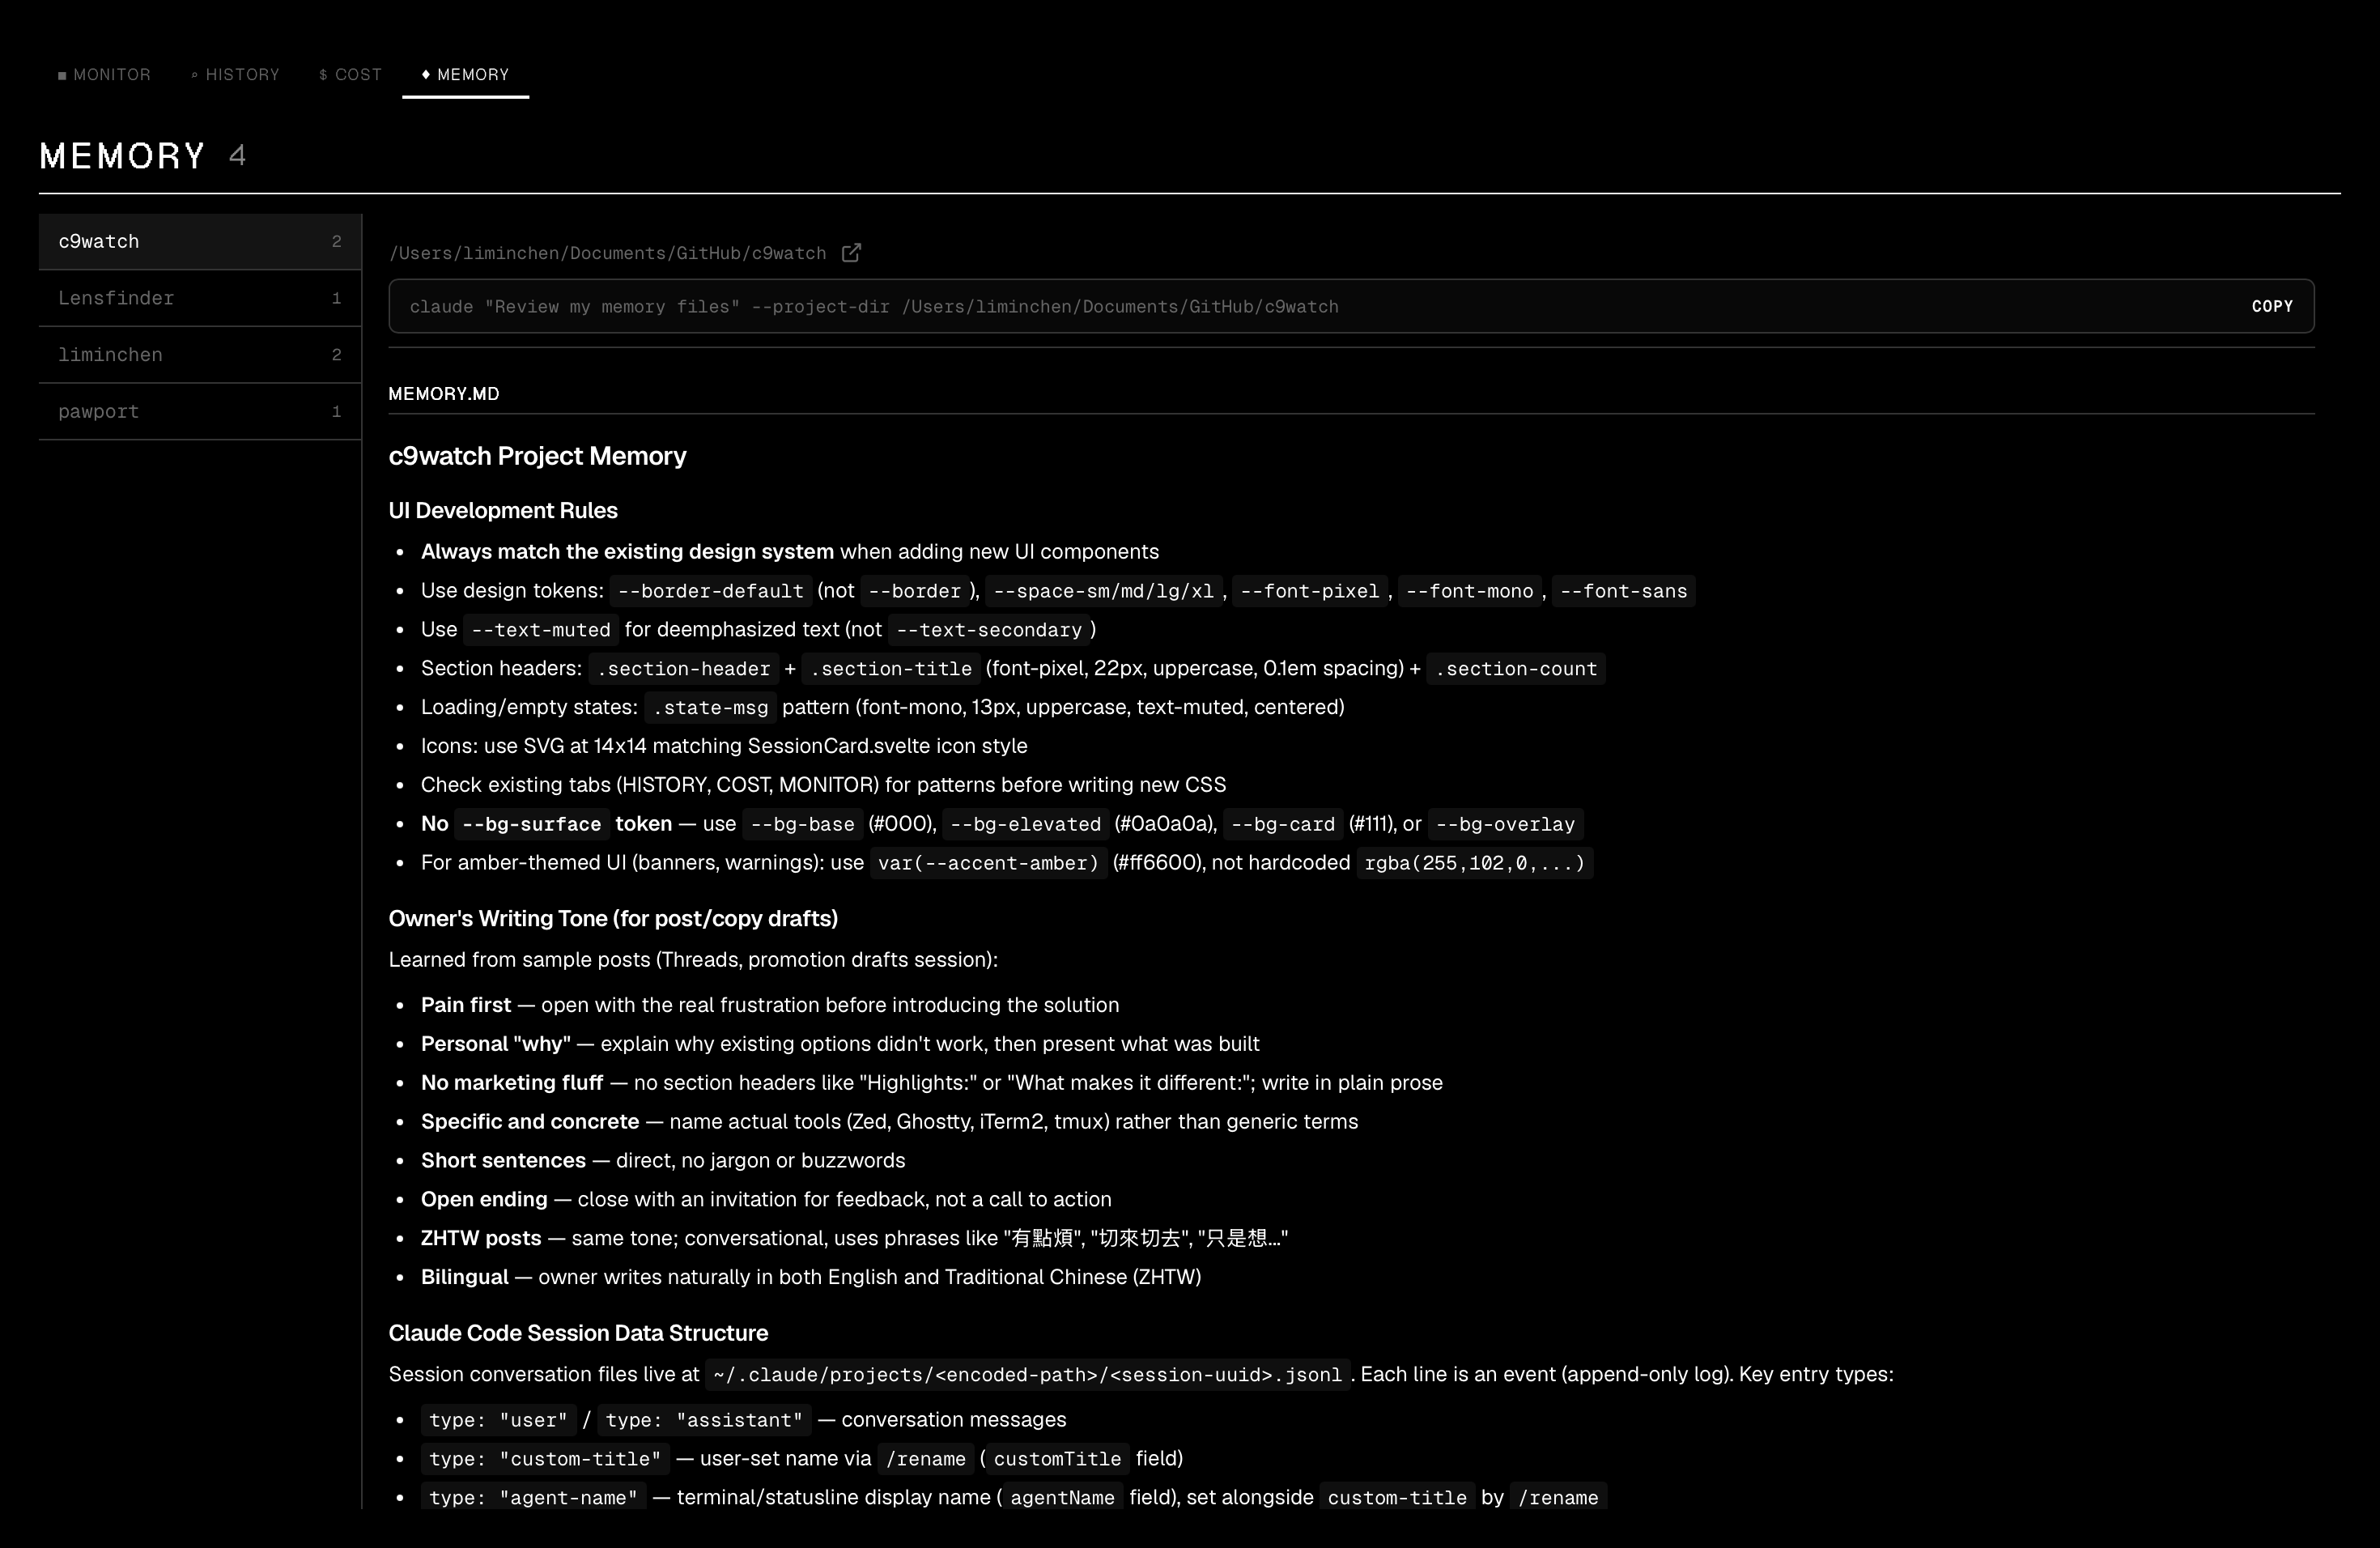
Memory viewer
Section titled “Memory viewer”Browse all your Claude Code memory files in a two-panel layout. The left panel lists all memory files organized by project, and the right panel shows the full content of the selected file.
Quick access to Claude commands lets you jump into sessions directly from the memory view.
CLI for agents
Section titled “CLI for agents”The same c9watch binary doubles as a command-line interface for scriptable session management. All output is JSON, designed for piping into jq or consumption by other coding agents.
c9watch list # List active sessionsc9watch list --status Working # Filter by statusc9watch status # Aggregate status summaryc9watch view <id> --last 5 --pretty # View conversationc9watch history -n 20 # Browse past sessionsc9watch search "fix the auth bug" # Deep searchc9watch self # Identify calling agent's own sessionc9watch stop <pid> # Stop a sessionc9watch watch --compact # Stream status changes (NDJSON)c9watch tasks <id> # View tasks/todosThe self command is designed for agent-to-agent workflows — a Claude Code session can identify itself by walking up the PID tree, then query its own status or tasks.
Install the CLI standalone (no GUI dependencies) on macOS or Linux:
curl -fsSL https://raw.githubusercontent.com/minchenlee/c9watch/main/install-cli.sh | bashc9watch also ships with a Claude Code skill — install it to let Claude Code auto-discover and use the CLI:
ln -s /path/to/c9watch/skills/c9watch-cli ~/.claude/skills/c9watch-cliFDA permission banner
Section titled “FDA permission banner”On macOS, c9watch needs Full Disk Access to read the working directory of Claude Code processes. If sessions are found but their paths can’t be read, a dismissible banner appears with a direct link to System Settings > Privacy > Full Disk Access.
Debug console
Section titled “Debug console”Press Cmd+Shift+D to open a hidden diagnostic panel that shows real-time detection logs — how many processes were found, which sessions matched, and which ones didn’t. Useful for troubleshooting when sessions aren’t appearing in the dashboard.